Canadian Housing Activity Remains in Holding Pattern
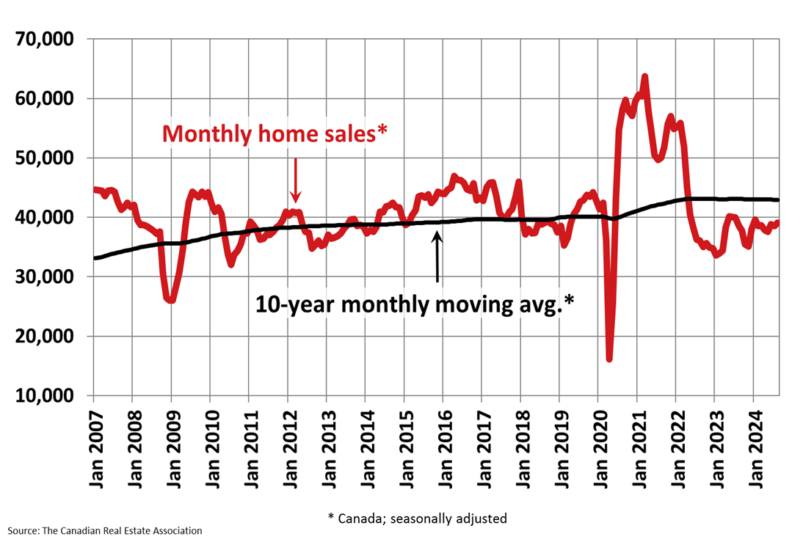
Ottawa, ON September 16, 2024 – National home sales increased in June following the Bank of Canada’s first interest rate cut since 2020, and activity posted another small gain in August on the heels of the second rate cut in late July, but the bigger picture appears to be a market mostly stuck in a holding pattern.
“Despite some fledgling signs of life to kick off the long-awaited monetary policy easing cycle, Canadian housing market activity still looks to be stuck in the same holding pattern it’s been in all year,” said Shaun Cathcart, CREA’s Senior Economist. “That said, with ever more friendly interest rates now all but guaranteed later this year and into 2025, it makes sense that prospective buyers might continue to hold off for improved affordability, especially since prices are still well behaved in most of the country.”
Home sales recorded over Canadian MLS® Systems edged up by 1.3% on a month-over-month basis in August 2024, reaching their highest level since January and their second highest in over a year.
Highlights:
- National home sales edged up 1.3% month-over-month in August.
- Actual (not seasonally adjusted) monthly activity came in 2.1% below August 2023.
- The number of newly listed properties ticked up 1.1% month-over-month.
- The MLS® Home Price Index (HPI) was unchanged month-over-month but was down 3.9% year-over-year.
- The actual (not seasonally adjusted) national average sale price was almost unchanged (+0.1%) on a year-over-year basis in August.
There were about 177,450 properties listed for sale on all Canadian MLS® Systems at the end of August 2024, up 18.8% from a year earlier but still more than 10% below historical averages of around 200,000 listings for this time of the year.
New listings posted a 1.1% month-over-month increase in August. For the second month in a row, the national increase was led by a much-needed boost in new supply in Calgary. New listings were also up in Edmonton, offsetting a decline in the Greater Toronto Area.
With sales rising by only slightly more than new listings in August, the national sales-to-new listings ratio moved up to 53%, almost unchanged from 52.9% in July. In fact, the measure has barely moved from its current level since April. The long-term average for the national sales-to-new listings ratio is 55%, with a sales-to-new listings ratio between 45% and 65% generally consistent with balanced housing market conditions.
“With more interest rate cuts now expected between now and next summer, the stage is set for a faster return of demand, but we’re clearly not there just yet,” said James Mabey, Chair of CREA. “There are typically four times in any given year that see a burst of new supply that can excite the market and draw buyers off the sidelines, and those are the first weeks of April, May, June, and September. So, the first week of September saw not only a third rate cut, but also a lot of new properties for buyers to consider. We’ll have to wait to see how they respond, but if you’re looking to buy or sell a property this fall, the first step is to contact a REALTOR® in your area today.”
There were 4.1 months of inventory on a national basis at the end of August 2024, down from 4.2 months at the end of July. Continuing the theme of the market being in a holding pattern, this measure of market balance has been range-bound between 3.8 months and 4.2 months since last October. The long-term average is about five months of inventory.
The National Composite MLS® Home Price Index (HPI) was unchanged from July to August, following two small increases in June and July. That said, the bigger picture is that prices at the national level have been basically flat since the beginning of the year.
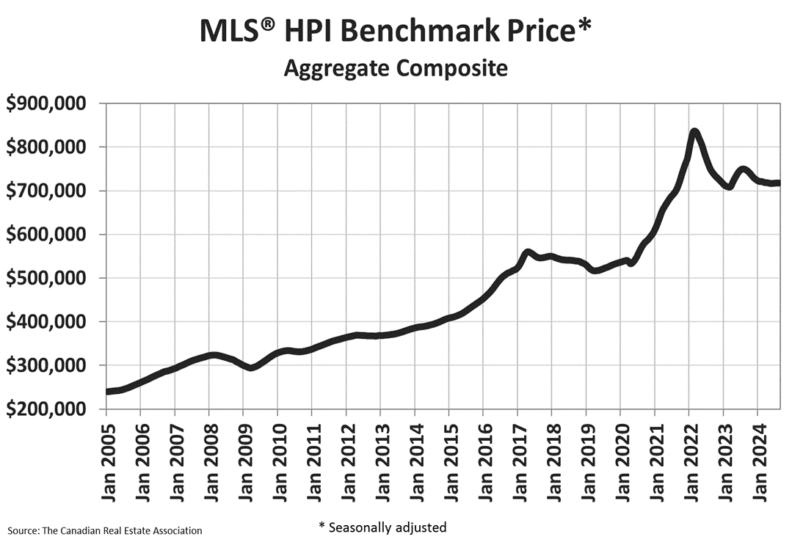
The non-seasonally adjusted National Composite MLS® HPI stood 3.9% below August 2023. This mostly reflects price gains last spring and summer that were followed by declines in the second half of last year. As such, it’s mostly likely that year-over-year comparisons with improve from this point on.
The actual (not seasonally adjusted) national average home price was $649,100 in August 2024, almost unchanged (+0.1%) from August 2023.
The next CREA statistics package will be published on Tuesday, October 15, 2024.
- 30 -
PLEASE NOTE: The information contained in this news release combines both major market and national sales information from MLS® Systems from the previous month.
CREA cautions that average price information can be useful in establishing trends over time but does not indicate actual prices in centres comprised of widely divergent neighbourhoods or account for price differential between geographic areas. Statistical information contained in this report includes all housing types.
MLS® Systems are co-operative marketing systems used only by Canada’s real estate boards to ensure maximum exposure of properties listed for sale.
The Canadian Real Estate Association (CREA) is one of Canada’s largest single-industry associations, representing more than 160,000 REALTORS® through 65 real estate boards and associations.
Further information can be found at http://CREA.ca/statistics.
For more information, please contact:
Pierre Leduc, Media Relations
The Canadian Real Estate Association
Tel.: 613-237-7111 or 613-884-1460
E-mail: pleduc@CREA.ca