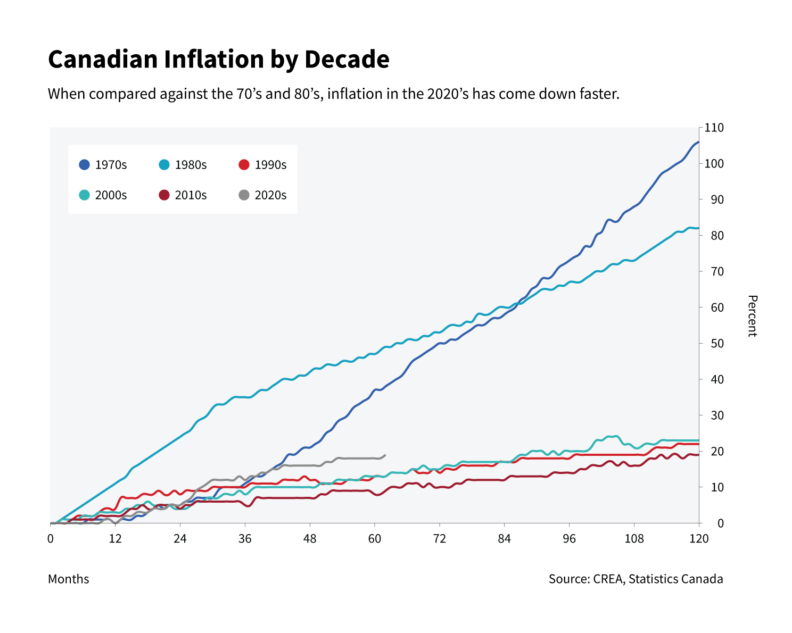
Chart of the Month: Inflation in Canada by Decade

CREA’s team of economists monitor economic and housing data daily from across the country and release updated reports on CREA Stats. Throughout the year, the team prepares dozens of presentations for different groups within the REALTOR® community, each with many charts, from general to incredibly niche, containing data all real estate professionals may find interesting.
The team is now sharing one chart (or chart group) per month on CREA Café that we don’t normally share in isolation to provide additional commentary and insight into the Canadian real estate market and economy.
This month, the chart we’re taking a closer look at references inflation in Canada by decade!
The data in this chart is pulled from the Canadian Real Estate Association (CREA) and Statistics Canada.
Adapted from Statistics Canada. Table 18-10-0004-01 Consumer Price Index, monthly, not seasonally adjusted. This does not constitute an endorsement by Statistics Canada of this product.
Jump Ahead
Inflation targeting: what is it, and why?
The Bank of Canada started to use inflation targeting as part of their monetary policy toolkit in early 1991. The policy was adopted as a response to the high inflation seen in the 1970s and 1980s (orange and navy lines), and how difficult it was to bring inflation down at the time. The target aims to keep overall Consumer Price Index (CPI) at the 2% midpoint target within a range of 1 to 3% over the medium term.
Inflation targeting helps ensure the value of currency remains stable, which is important for consumers and businesses making long-term financial decisions such as buying a house, saving for retirement, or deciding whether to invest in machinery and equipment.
Since the early 1990s, inflation as measured by Statistics Canada’s CPI has generally aligned with its 2% target.
Consumer Price Index (CPI)
The CPI represents changes in price as experienced by Canadian consumers and measured by comparing the cost of a fixed basket of goods and services throughout time and is published for various levels of geography in Canada. There are eight categories of goods and services measure:
- Food
- Shelter
- Household operations, furnishings, and equipment
- Clothing and footwear
- Transportation.
- Health and personal care
- Recreation, education and reading
- Alcoholic beverages, tobacco products and recreational cannabis
(Source: Statistics Canada)
What’s trending based on these charts?
The COVID-19 pandemic had a large effect as we welcomed our current decade with the largest impacts beginning in early 2020.
After the initial market shock caused by the pandemic, inflation started to spiral out of control as health restrictions were lifted across the country. This was, in part, due to global supply chain constraints, a global energy shock from Russia’s invasion of Ukraine (2022), and accommodative fiscal and monetary support for Canadians.
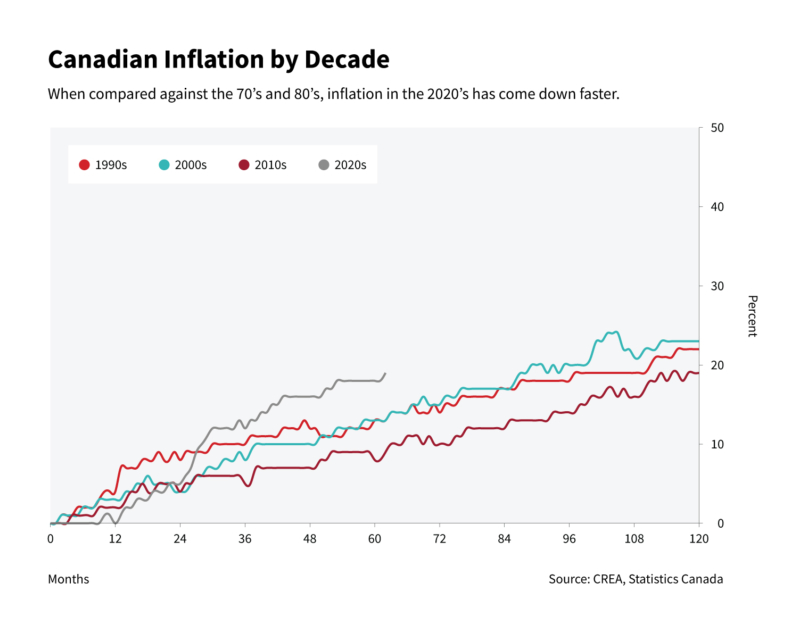
What this chart demonstrates is that so far in the 2020s (red line), we’ve experienced as much cumulative inflation as we did in the entire previous decade, the 2010s (light blue line).
Interest rates as a factor to inflation
The Bank of Canada has made an effort to bring the pace of inflation back in line with the 2% target that we mentioned above.
What the Bank has attempted to avoid is the inflationary patterns Canada saw in the 1970s and 1980s, when two global oil price shocks, skyrocketing energy prices, and loose monetary and fiscal policy, contributed to high inflation and affected prices for everyday goods and services. This led to economic uncertainty, significant policy shifts from the Bank of Canada, and major interest rate hikes, with rates rising as high as 22.75% in August 1981. The government at that point in time had a hard time controlling inflation and knew that a repeat of this scenario could be severely damaging for consumers and small businesses to plan for the future.
By raising interest rates to one of the highest levels in recent history, peaking at 5% from July 12, 2023, until being reduced to 4.75% on June 4, 2024, the Bank has managed to bring the pace of inflation back to that 2% target.
Tariffs and trade uncertainty
The recent trade uncertainty with the United States, including tariffs, alongside increase global trade tensions has the potential to spark another bout of inflation just as the Bank of Canada thought they had it under control.
CREA continues to monitor these developments closely to inform their projections as the situation is evolving day-by-day.
What REALTORS® can learn from inflation trends
Understanding inflation trends can help REALTORS® to contextualize the factors affecting their clients or prospective clients when it comes to selling or buying a home, especially during uncertain periods, and aid in communicating in an empathetic and informed manner during one of the largest purchases in most people’s lives.
For more data, check out CREA Stats on a regular basis where CREA’s team of economists releases monthly and quarterly analyses.
The information contained in this report has been prepared by The Canadian Real Estate Association drawn from sources deemed to be reliable, but the accuracy and completeness of the information is not guaranteed. In providing this information, The Canadian Real Estate Association does not assume any responsibility or liability. Copyright © 2025 The Canadian Real Estate Association. All rights reserved. Reproduction in whole or in part is prohibited without written permission.